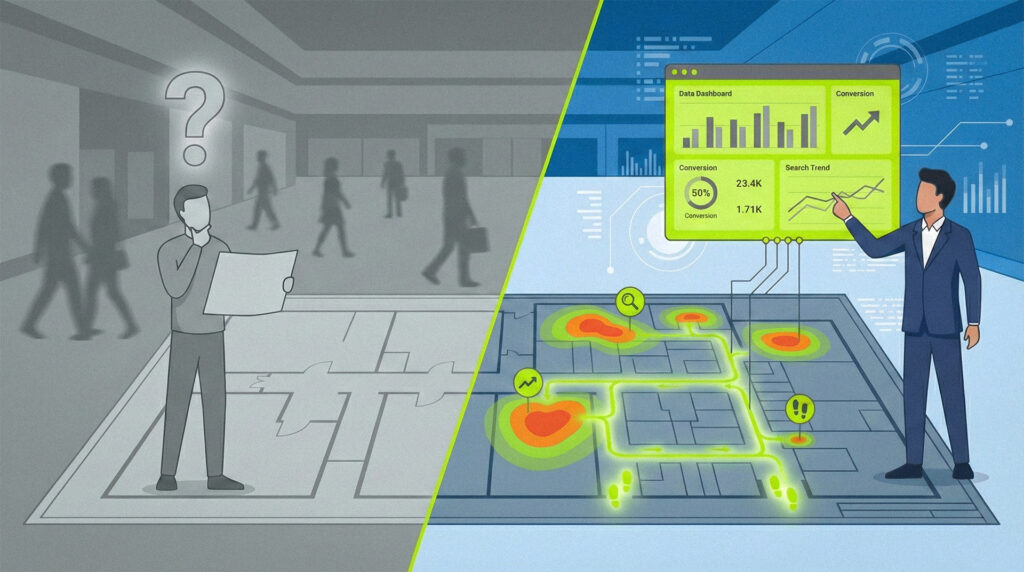
Walk into any modern shopping center and you’ll see crowds moving, stopping, browsing — but are you actually seeing what’s happening? Most property managers operate on instinct and outdated assumptions about customer behavior. Meanwhile, competitors are using retail analytics to make data-backed decisions that directly impact tenant sales, occupancy rates, and per-square-foot revenue.
The difference isn’t luck. It’s measurement.
What Are Retail Analytics?
Retail analytics refers to the systematic collection and analysis of customer behavior data within physical retail environments. Rather than relying on vague traffic estimates or anecdotal feedback, retail analytics platforms track quantifiable metrics like foot traffic patterns, dwell time, search behavior, and conversion zones.
Key metrics include:
- Foot traffic volume: How many visitors enter specific zones
- Dwell time: How long customers spend in high-value areas
- Search intent: What stores, products, or amenities visitors actively look for
- Heat maps: Visual representations of high-traffic vs. underutilized zones
- Conversion tracking: Movement from browsing to purchase-ready behavior
Shopping centers that leverage these metrics gain clear visibility into what’s working and what’s wasting space. The data reveals patterns that gut instinct simply can’t catch.
Why Retail Analytics Matter for Shopping Centers
Shopping centers face a unique challenge: they’re not just managing their own performance, but the success of dozens (or hundreds) of individual tenants. When a tenant underperforms, lease renewals fall through. When foot traffic stagnates, anchor stores lose interest. And when customer experience suffers, the entire property pays the price.
Retail analytics solves these problems by answering critical questions:
- Which zones attract the most traffic — and which are dead space?
- What are visitors searching for that they can’t find?
- How long do customers spend near specific tenants or promotions?
- Which marketing campaigns actually drive measurable engagement?
Without analytics, these questions get answered with guesswork. With analytics, they’re answered with proof.
Retail Analytics in Action: Real-World Applications
Optimizing Layouts and Tenant Placement
Not all square footage is created equal. High-traffic corridors command premium lease rates, while tucked-away corners sit vacant. Retail analytics reveals which zones generate the most engagement — and which are wasted real estate.
Example use case:
A shopping center discovers through heat mapping that a side wing near restrooms sees minimal traffic despite housing premium tenants. By rerouting foot flow with updated signage and strategic digital kiosk placement, the property increases zone traffic significantly. Tenant sales rise accordingly, and lease renewals become easier.
Aligning Promotions with Search Intent
Traditional marketing relies on broad campaigns with limited targeting. Retail analytics flips the script by tracking what visitors actively search for — then delivering promotions that match intent.
If data shows high search volume for “kids clothing” but low engagement with children’s stores, property managers can:
- Highlight relevant tenants through digital directory placements
- Run geo-targeted promotions using location-based advertising to guide visitors directly to those stores
- Adjust signage and wayfinding to improve discoverability
The result? Higher conversion rates and stronger tenant performance.
Proving ROI on Events and Campaigns
Shopping centers host events, seasonal activations, and vendor pop-ups constantly — but how many can quantify their impact? Retail analytics provides concrete proof of success (or failure) by tracking engagement before, during, and after campaigns.
Measurable KPIs include:
- Lift in foot traffic during event windows
- Increased dwell time near activated zones
- Search queries tied to event-related keywords
- Route creation and wayfinding requests toward event areas
When a center can show vendors that a weekend activation drove thousands of additional visitors and measurably increased nearby tenant sales, event sponsorships become easier to sell — and justify.
The Technology Behind Modern Retail Analytics
The best retail analytics platforms don’t just collect data — they make it actionable. This requires a combination of hardware, software, and integration across multiple touchpoints.
Core components include:
| Technology | Function |
|---|---|
| Indoor positioning systems (IPS) | Tracks real-time visitor location and movement |
| Interactive kiosks and mobile maps | Captures search queries, route requests, and engagement |
| Heat mapping software | Visualizes high-traffic zones and underutilized areas |
| API integrations | Connects analytics with CRM, tenant dashboards, and marketing tools |
Modern platforms also leverage AI assistants to identify patterns that human analysts might miss — such as subtle shifts in weekend vs. weekday behavior or seasonal trends that impact specific tenant categories.
How MapVX Turns Spatial Data Into Revenue
While many analytics platforms stop at data collection, MapVX is built to drive measurable business outcomes. Our advanced spatial analytics suite doesn’t just show you what’s happening — it helps you act on it.
MapVX retail analytics features include:
- Real-time dashboards: Monitor foot traffic, search trends, and dwell times across your entire property
- Search intent tracking: See exactly what visitors are looking for — and where they’re struggling to find it
- Heat maps and engagement zones: Identify high-value areas and optimize underperforming spaces
- Ad performance analytics: Measure the ROI of on-map promotions, sponsored listings, and location-based campaigns
- Integrated wayfinding data: Understand how visitors navigate your property and where friction points exist
Because MapVX combines interactive mapping with deep analytics, property managers get a complete picture of customer behavior — from initial search to final destination.
The Competitive Advantage of Data-Driven Decision Making
Shopping centers that adopt retail analytics gain a strategic edge over competitors still operating on intuition. They can:
- Justify premium lease rates with traffic data
- Attract high-performing tenants by proving foot flow
- Optimize marketing spend with measurable campaign ROI
- Reduce vacancy rates by improving underperforming zones
- Enhance customer experience through smarter wayfinding and discovery
Properties using advanced analytics consistently report higher tenant satisfaction and longer lease durations compared to those relying on traditional methods. The message is clear: data wins.
Getting Started with Retail Analytics
Implementing retail analytics doesn’t require a complete infrastructure overhaul. The best platforms integrate seamlessly with existing systems — kiosks, mobile apps, CRM tools — to start delivering insights immediately.
Key steps to adoption:
- Identify your goals: Do you want to optimize layouts? Improve tenant sales? Increase event ROI?
- Choose a platform built for retail environments: Look for solutions designed specifically for shopping centers, with features like multi-level navigation and real-time data capture
- Start with high-impact metrics: Focus on foot traffic, search intent, and dwell time before expanding into advanced analytics
- Use insights to drive action: Data is only valuable if it leads to decisions — adjust layouts, refine promotions, and prove results to stakeholders
With the right platform, retail analytics becomes not just a tool, but a competitive advantage.
Transform Your Property with MapVX
Ready to turn foot traffic into measurable revenue? MapVX’s retail analytics platform provides the insights you need to optimize layouts, drive tenant success, and prove ROI on every marketing dollar.
Book a demo to see how MapVX can transform your shopping center’s performance, or explore our plans and pricing to find the right solution for your property.